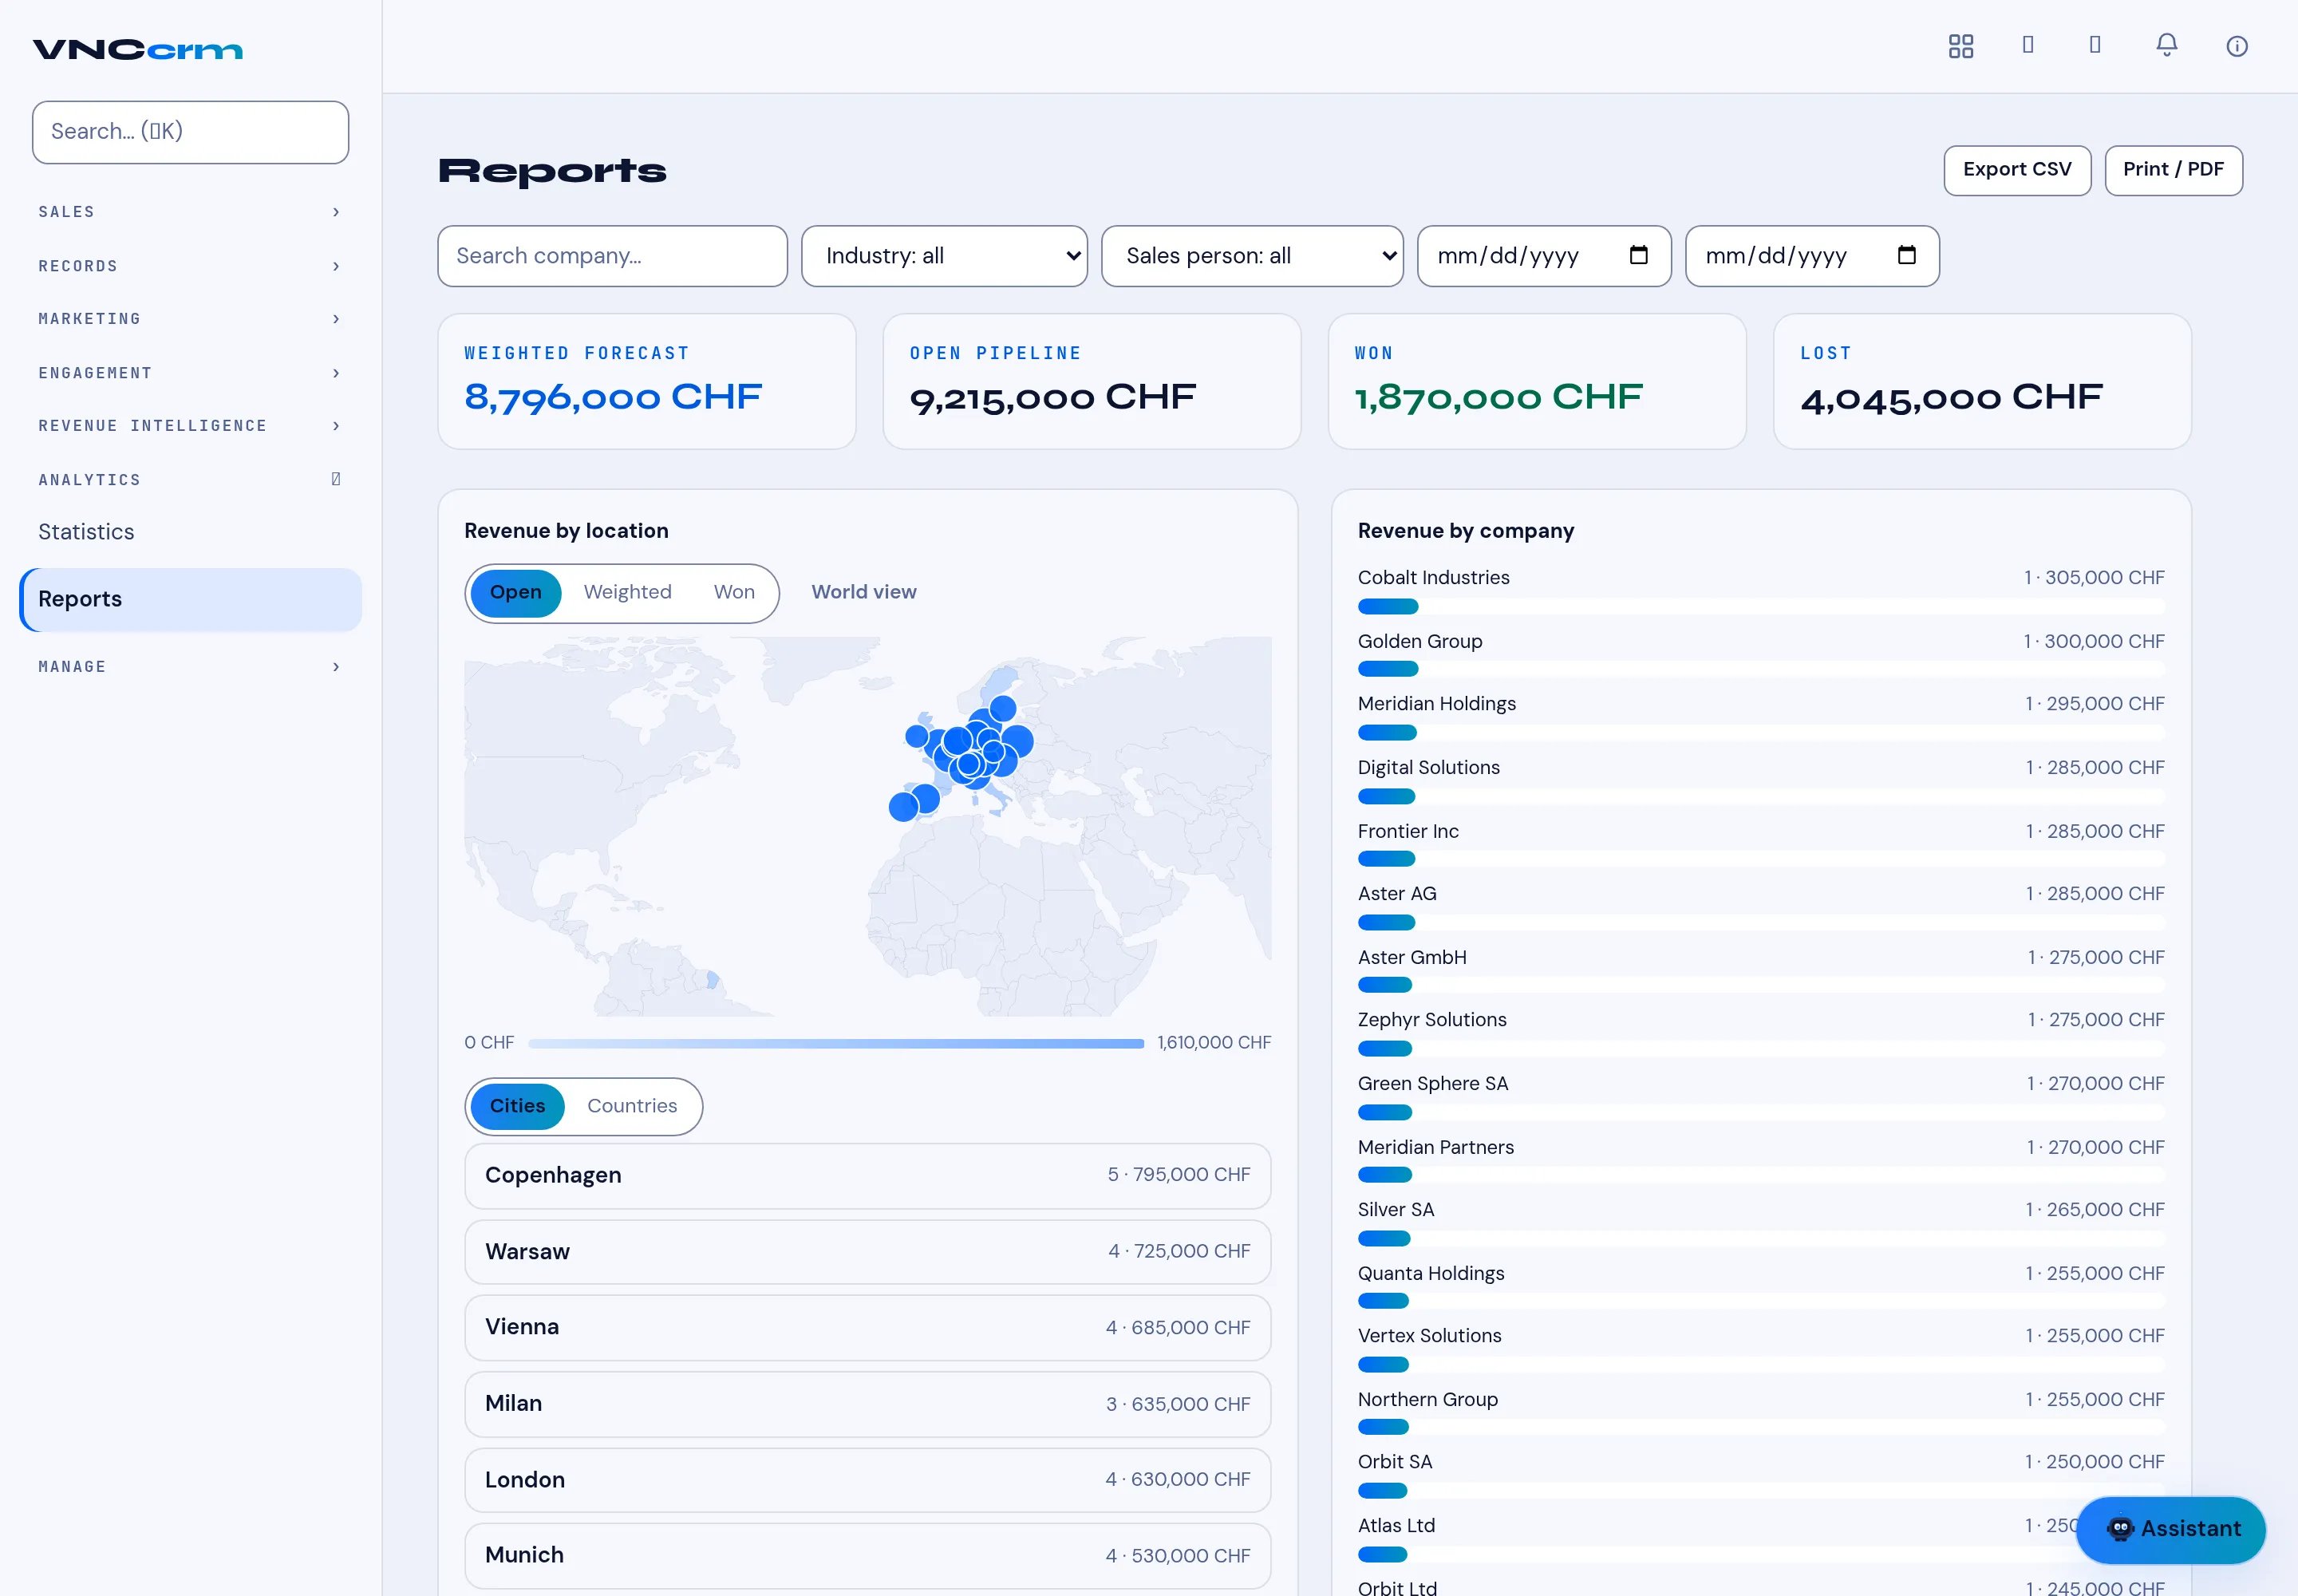
Reports
Reports (under ANALYTICS) is the exportable view of the pipeline.
Filters and totals
Section titled “Filters and totals”Filter by company, industry, sales person and a date range (two date pickers). The KPI band then totals:
| Card | Meaning |
|---|---|
| Weighted forecast | Σ potential × probability. |
| Open pipeline | The value still open. |
| Won | Value won in the range. |
| Lost | Value lost in the range. |
Panels
Section titled “Panels”- Revenue by location — a map with Open / Weighted / Won and a World view, plus the Cities / Countries ranking.
- Revenue by company — the ranked list of companies by value.
Export CSV downloads the data and Print / PDF produces a printable report.